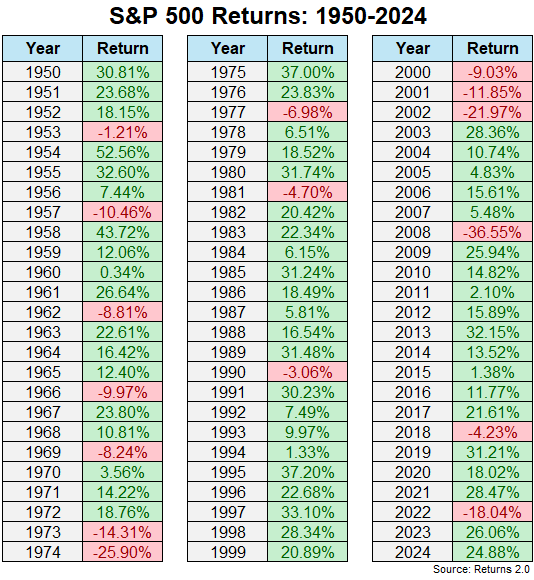
Every year I update long-term return numbers for all of my various spreadsheets for charts, graphs, tables and such.1
From 1928-2024, the S&P 500 was up 9.94% on an annual basis.
That’s pretty good.
The last couple of years have seen strong returns (+26% and +25%, respectively) so I noticed the long-run number was ticking up. After the bloodbath in 2022, the long-term annual return was 9.6%. So the past two years have made an impact, albeit a small one.
But the bull market we’ve been in since the end of the Great Financial Crisis has had a substantial impact on the long-run return numbers.
From 1928 through the end of 1999 the annual return was 10.8%. Then we went through a lost decade, bookended by two of the biggest market crashes in history. By the end of 2008, the annual return since 1928 has dropped all the way from 10.8% to 9.1%. So we lost 1.7% annually but has gained back almost 1% per year since then.
Any of those long-term returns are great for long-term investors but the bull and bear market cycles can have an impact, even on the long-run.
You can get too cute by playing with start and end dates but I liked this question from a podcast listener this week:
When Ben was talking about how the lost decade skewed the long term returns, and how today they have recovered to 10% what is interesting to me as well is that you usually see these averages start in 1928. Why not a different year? 1928 was basically the top, right before the biggest drop we’ve ever seen. I wonder what the annualized returns would be if you did from say 1932? Or, what if you started the backtest in 1929 at the peak, and ended the test at the lows in 2008/09?
I like it. Let’s have some fun with numbers.
This is what it looks like if we take the gigantic crash from the Great Depression out of the data:
1932-2024 +11.1%
Taking out just four years from the start of the dataset makes a big difference.
The returns look even better if we take World War II and the aftermath of the Great Depression off the table:
Compounding at 11.5% for 75 years would have turned an initial $10,000 investment in the S&P 500 into…$36 million! That’s not a typo. Obviously, there are no taxes or fees taken into account, there were no index funds back then, and no one really has a 75-year timeline etc., etc.
Still.
Now here are the numbers from 1929 through the end of 2008:
That’s a pretty decent gap down but still not bad all things considered.
These are the returns this century which start from the peak of the dot-com bubble:
So while the returns since the Great Financial Crisis have been insanely good, when you lump them in with a lost decade and the past 25 years are just OK.
I always say you can win any market debate by changing your start or end date but the important point here is that a long time horizon is your friend as an investor.
There will always be volatility over the short-term. You could even experience godawful returns over a decade.
But when you have a multi-decade time horizon the compounding you experience in the stock market can be incredible.
Michael and I talked about long-term stock market returns and much more on this week’s Animal Spirits podcast:
Subscribe to The Compound so you never miss an episode.
Further Reading:
Historical Returns For Stocks, Bonds, Cash, Gold and Real Estate
Now here’s what I’ve been reading lately:
Books:
1This website from NYU is one of my go-to datasets for long-term return numbers.
This content, which contains security-related opinions and/or information, is provided for informational purposes only and should not be relied upon in any manner as professional advice, or an endorsement of any practices, products or services. There can be no guarantees or assurances that the views expressed here will be applicable for any particular facts or circumstances, and should not be relied upon in any manner. You should consult your own advisers as to legal, business, tax, and other related matters concerning any investment.
The commentary in this “post” (including any related blog, podcasts, videos, and social media) reflects the personal opinions, viewpoints, and analyses of the Ritholtz Wealth Management employees providing such comments, and should not be regarded the views of Ritholtz Wealth Management LLC. or its respective affiliates or as a description of advisory services provided by Ritholtz Wealth Management or performance returns of any Ritholtz Wealth Management Investments client.
References to any securities or digital assets, or performance data, are for illustrative purposes only and do not constitute an investment recommendation or offer to provide investment advisory services. Charts and graphs provided within are for informational purposes solely and should not be relied upon when making any investment decision. Past performance is not indicative of future results. The content speaks only as of the date indicated. Any projections, estimates, forecasts, targets, prospects, and/or opinions expressed in these materials are subject to change without notice and may differ or be contrary to opinions expressed by others.
The Compound Media, Inc., an affiliate of Ritholtz Wealth Management, receives payment from various entities for advertisements in affiliated podcasts, blogs and emails. Inclusion of such advertisements does not constitute or imply endorsement, sponsorship or recommendation thereof, or any affiliation therewith, by the Content Creator or by Ritholtz Wealth Management or any of its employees. Investments in securities involve the risk of loss. For additional advertisement disclaimers see here: https://www.ritholtzwealth.com/advertising-disclaimers
Please see disclosures here.
